Baby Teeth are Temporary, Model Interpretability is Forever
Focus Too Much On the Big Picture, Get $10k In Dental Bills
When I found out baby teeth fall out, I realised the futility brushing them. The teeth are temporary, but those extra 5 minutes of playing Pokemon are forever. So I quit brushing my teeth. This wouldn’t have been too big a problem for a normal kid, but I also refused to drink water. A strangely pervasive problem in our family that started young (my brother was weaned off breast milk using chocolate Breaka) and lived into adulthood. I exclusively drank Golden Circle Raspberry Cordial, called it pink juice, carried it in my drink bottle, and I would sooner collapse from dehydration before I drank anything else. As you can imagine my teeth decayed at an alarming rate. A visit to the dentist in second grade told my parents something they were well aware of. If you let a child make their own terrible health decisions, they will cost you $10k in dental bills because apparently to a child, pain is an illusion. A lesson that should have been no surprise to them since that same year I made Mum let me slip my broken arm out of its cast to do my ballet examination, and I was still annoyed I only got a Merit. I don’t know if all kids are immune to pain and the consequences of their actions, but I certainly was. So for years I had 4 metal crowns, 13 fillings, and a sudden jolt of pain every time I accidentally got aluminium in my mouth. As an adult I leant my lesson and brush my teeth and floss twice a day. I mean I still don’t drink water, I just upgraded from Pink Juice to Pepsi Max. But I still consider a 50% improvement an inspiring story of growth.
What is the point of this story? Is it related to today’s topic or has this blog become a digital diary where I decompress years of a being a child psychopath with irresponsible parents? Both. Although if my parents has a say in this blog they would probably argue they weren’t irresponsible, but rather thought the best way for us to learn was to experience the consequences of our decisions. The problem in my decision making as a child was I had too much of a focus on the long term. While it was true that the teeth were not permanent and would fall out, I still cringe at the idea of biting into metal packaging. Most methods of understanding machine learning models focus on the model as a whole, but in this post we are going to look at the local interpretation. LIME (Localised Interpretable Models) is a model interpretation method that can be applied to any machine learning algorithm, even if its a “black box” method by breaking it into smaller local models that are easy to interpret. To understand the value in this, we need to first look at the flexibility and interpretability trade off.
The Flexibility and Interpretability Trade Off
I have mentioned (at length) the bias and variance trade off that comes into play when considering the flexibility of a model. What I have not mentioned, is the interpretation trade off that happens at the same time. When we “localise” our model by increasing its flexibility, allowing it to better respond to changes in variables, we also “localise” the possible interpretation. This in turn, means that a single interpretation for the entire span of the possible inputs is no longer useful. At the extreme end of this trade off, we have models in which the intermediate steps are almost impossible to understand, called “black box” models. Early statistics courses introduce flexibility with quadratic models, and deal with the trade off by splitting the area of interpretation. Sadly this is not an idea that easily lends itself easily to more complicated models, a problem I have illustrated below.
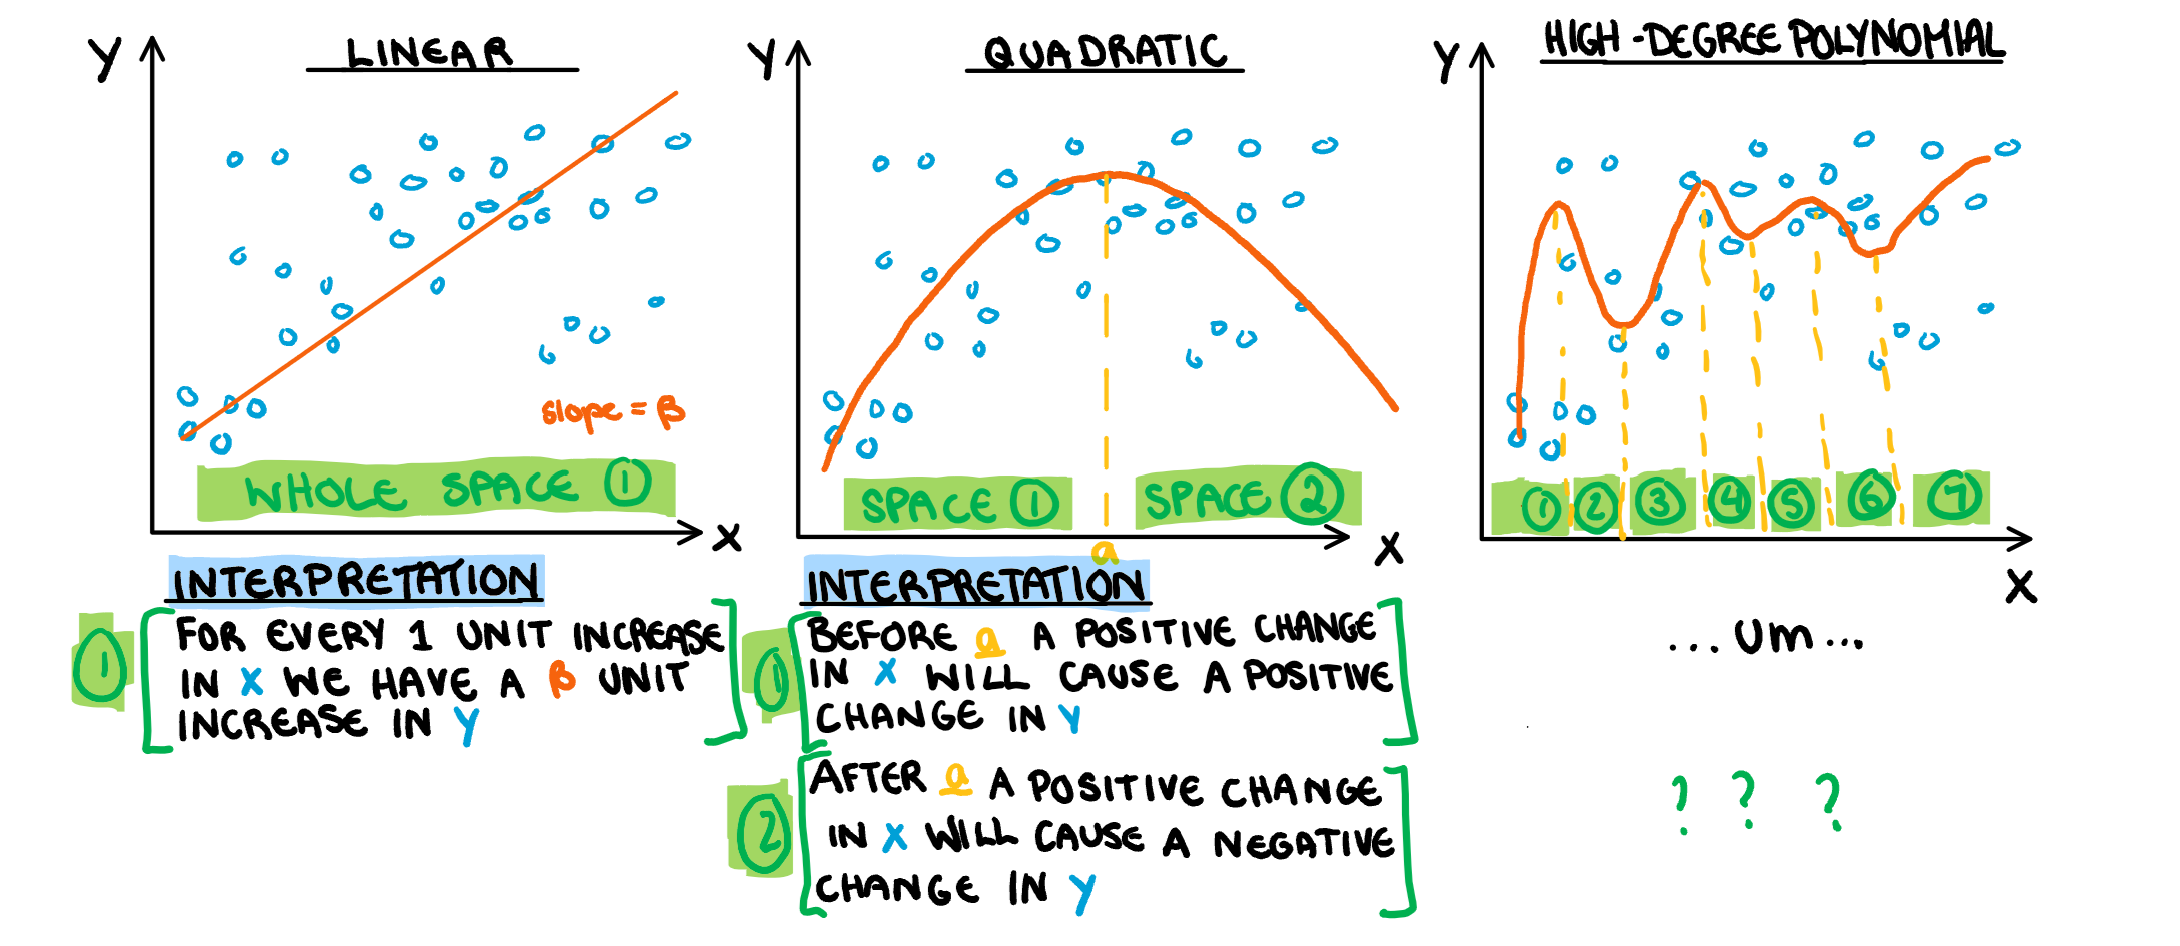
As we start to get into more complicated models our interpretation methods slightly abandon this idea of localising our understanding and instead opt for completely new techniques, like permutation variable importance which I discussed in a previous post. Instead of inventing a new way to understand our models LIME tries to make the interpretation more “localised” in the same way that flexibility “localised” the model itself.
How does it work?
The main idea of LIME is the same main idea of calculus, which is if we zoom in a bunch we can approximate crazy non-linear functions with straight lines. These approximations are pretty good around that point, but get worse the further we move away. The way it works is actually quite simple and can be broken down into a handful a simple steps. 1. Make a localised dataset based on a single observation 2. Build a model on this localised dataset 3. Interpret that model. Some of the technicalities of the process change depending on the type of data we have (tabular, images or text) and I will go through each of them, but in essence, the idea is the same. I’m going to walk through trying to predict cavities based on the three types of data to illustrate the process of LIME, but keep in mind, I’m assuming we already have some trained model that is making prediction, and a set of test observations. Is crushing pain, blackening teeth, or an exclusive diet of raspberry cordial a predictor of cavities? Lets find out.
Tabular Data
The first method we are going to look at is tabular data. Lets say instead of doing normal dentistry work my dentist wants to predict if I have cavities based on how often I say I brush my teeth, and how much sugar I eat a day. This is a hypothetical world and my hypothetical doctor is omnipotent apparently. He wants to classify his patients into 3 levels based on the financial commitment they are probably about to make to his family practice. He puts my teeth brushing and sugar intake into the model, and it looks like his family should start packing their swimmers, because they are about to go to Hawaii. But how did the model come up with the prediction? In enters, LIME.
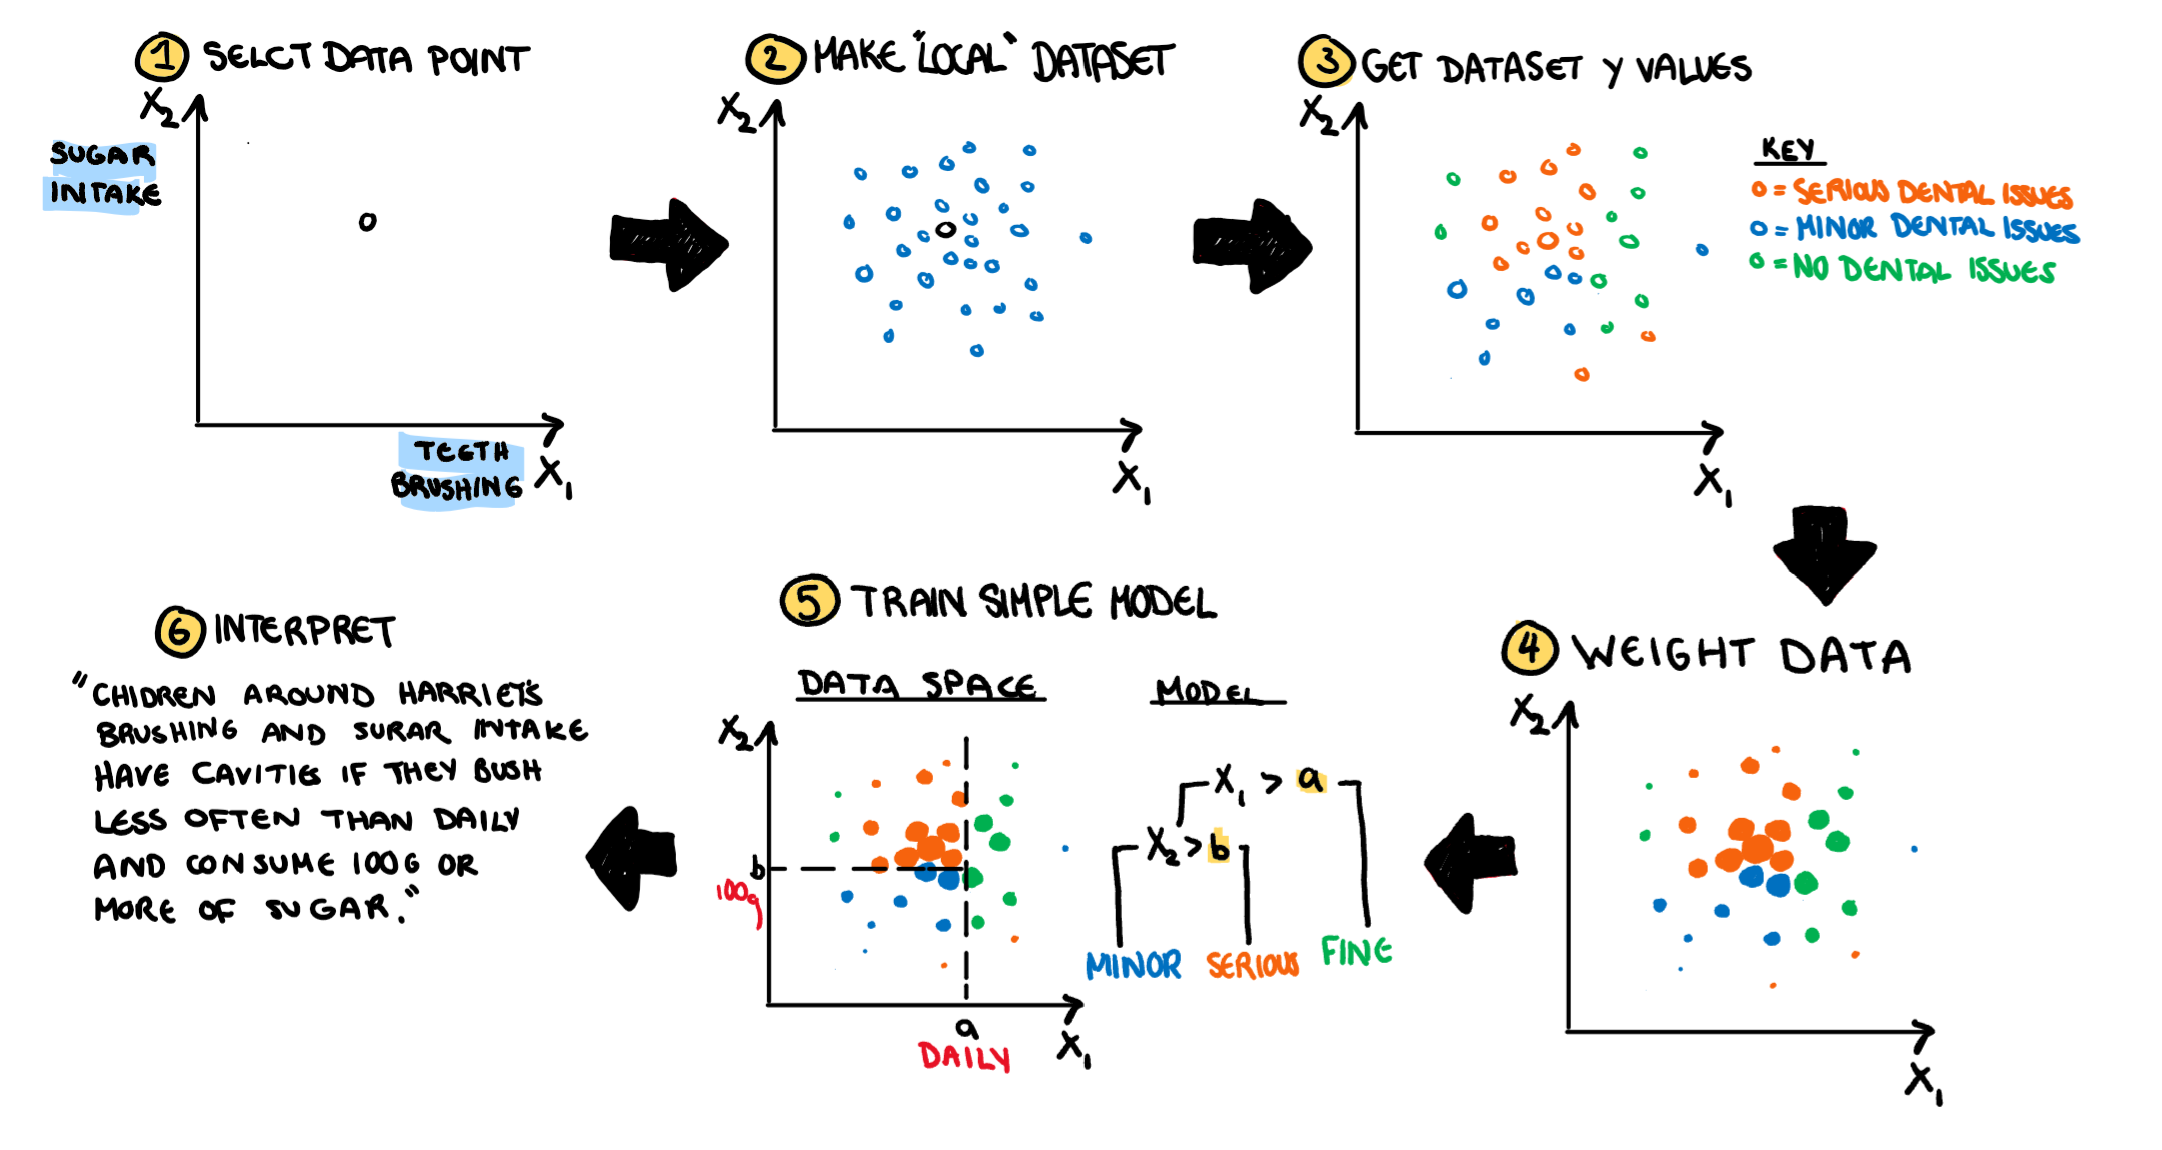
Illustrated below (and explained in this paragraph) is the process LIME will go through to understand this classification. First we select a single point to run our model on, in this case, me or an observation very close to me. Then LIME will generate some “pretend” data around it according to independent Gaussian distributions. As a side note, this means it ignores correlation, and can generate some points that are unlikely to occur in the real data. Then LIME will run our real data point point and all its fake friends through the black box model and find their hypothetical predictions. Similar to LOESS models, the observations are then reweighted based upon their distance to to the initial(only real) data point. Remember, we aren’t trying to understand the model overall, we are only interested in the area surrounding our point. Now, on our fake, weighted data, we train an easy to interpret model. Something like a tree model or linear regression. It doesn’t have to be even slightly similar to the black box model we are analysing, all that matters is that it is a model that is simple, easy to understand and easy to explain.
Images
So my dentist is rubbing his hands together when my mum brings me in for a check-up. Once again ignoring normal dental procedures (I’m starting to wonder if this man is a dentist or some back alley scam artist my parents dug up to teach me a lesson) the dentist decides to take a normal photo of my teeth and predict the probability I have a cavity. His picture based model also suggests cavities, but once again, how did it make that decision? LIME is back to his rescue.
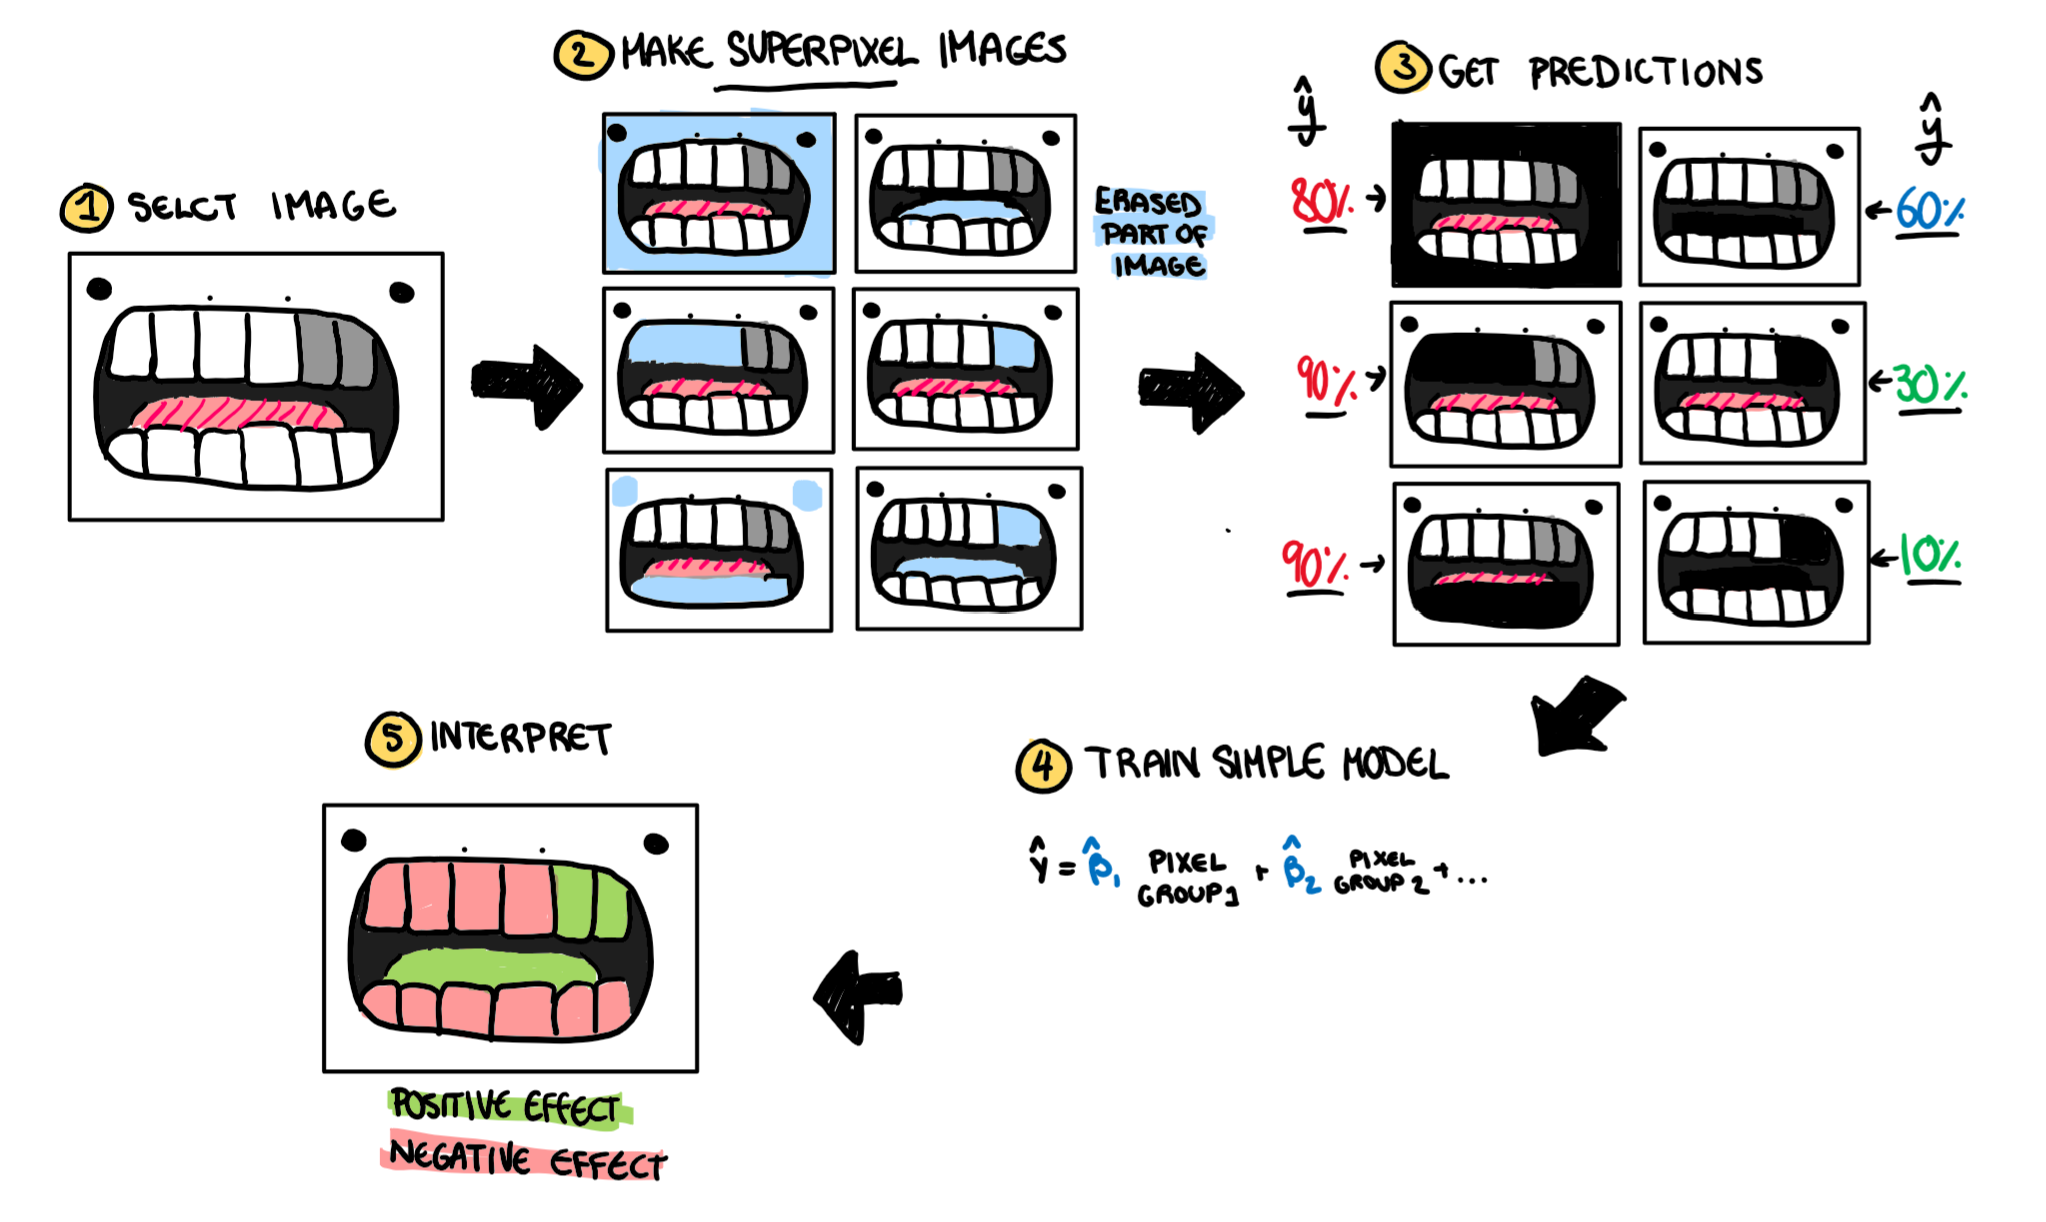
Once again we select some observation from our dataset, in this case, a photo of my sad decaying teeth. Next, following the tabular method, we would want to create a fake dataset of similar observations, but this is where we run into our first problem. Distance is easy to see in tabular data, its our normal run of the mill Euclidean distance. But how do we define distance for pictures? What metric can we use to say how similar two pictures are. This isn’t a question LIME answers, or even tries to answer but the little algorithm that could does it’s best to work through it. On pictures, rather than making our fake observations a sample that is “close” to the observation in distance, it varies the “superpixels” of the image. Superpixels are just a group of pixels that are next to each other and look similar so they are grouped together. for example, if you had a picture of my face; my skin, hair, lips, etc. would each be their own superpixel. To make our new dataset, LIME turns random super pixels off to create our local dataset. i.e. the pixels in that group cease to exist, are changed to 0, become a black hole of lost information in the land of data. Now we have a bunch of pictures that we run through the black box model to get some cavity prediction. Once again a simple model (like a linear regression) is built using the superpixels as inputs and the probability of a cavity as an output. The image is coloured by LIME based on having a positive impact on the classification or a negative impact.
Text
Finally after my dentist(?) finishes his dental(?) work, he decides to predict the chance of an expensive revisit based on my conversation with my Mum on our way out. This is a simple classification problem again and the model predicts I will be back with an expensive cavity. Finally, the dentist(??) implements LIME one more time.
The method for text is almost identical to the images, only instead of superpixels, it turns words off and on. 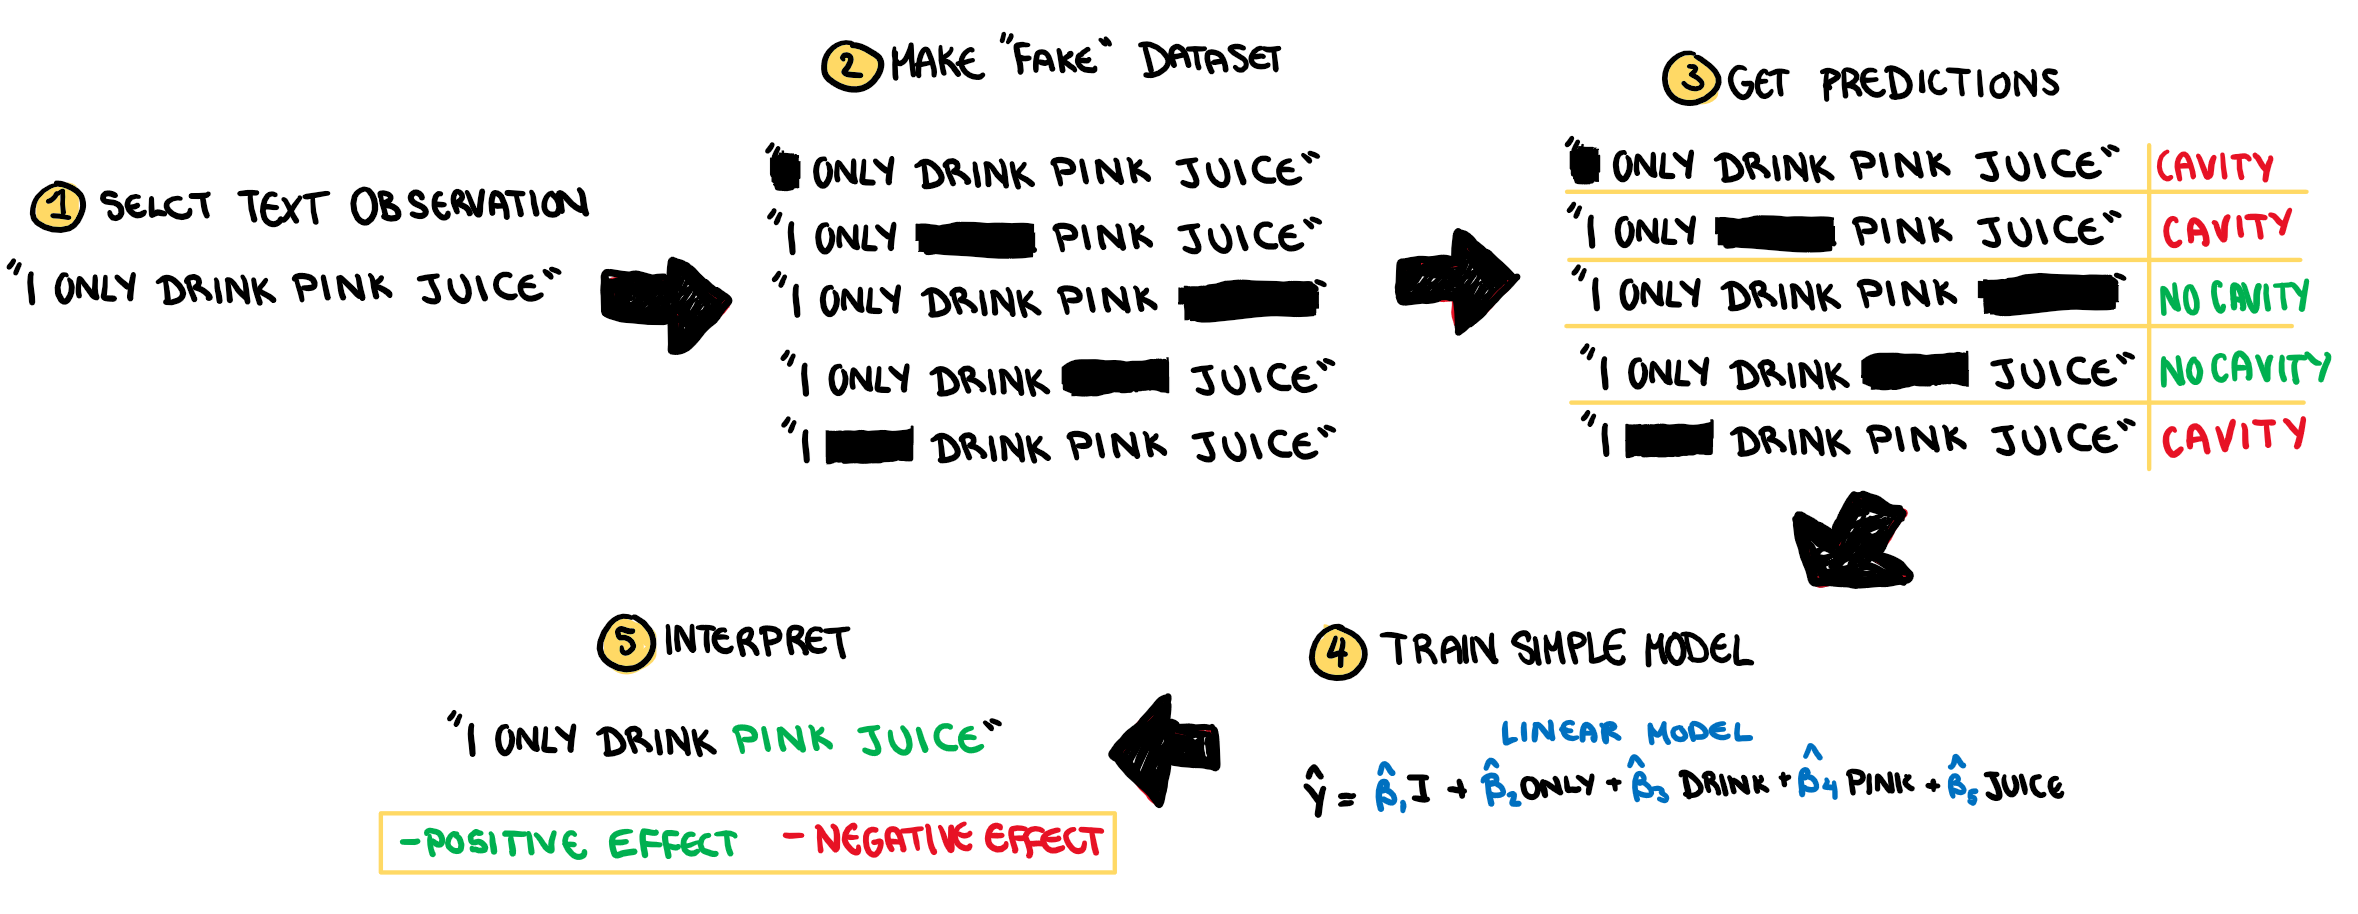
Limitations of The Method
The obvious problem with LIME is the same thing that made it a good idea, and the same reason some people think the earth is flat. If we zoom in too much, we lose sight of the big picture. Since our understanding is limited to single real observation from our dataset, and running it on every observation would be computationally painful, it is at our discretion which observations, and how many observations we run LIME on to understand what is under the hood of a black box model. While I only went through a general understanding of how the process works, there are other posts out there that discuss practical implementation of the model and some of the more technical aspects of how it works which are certainly worth a read.
In Conclusion
If something is called “pink juice” it will give you cavities, and if your dentist uses machine learning algorithms instead of normal dental practices, he might not be an actual dentist.

This work is licensed under a Creative Commons Attribution-NonCommercial-ShareAlike 4.0 International License.— title: “Untitled” editor: visual —